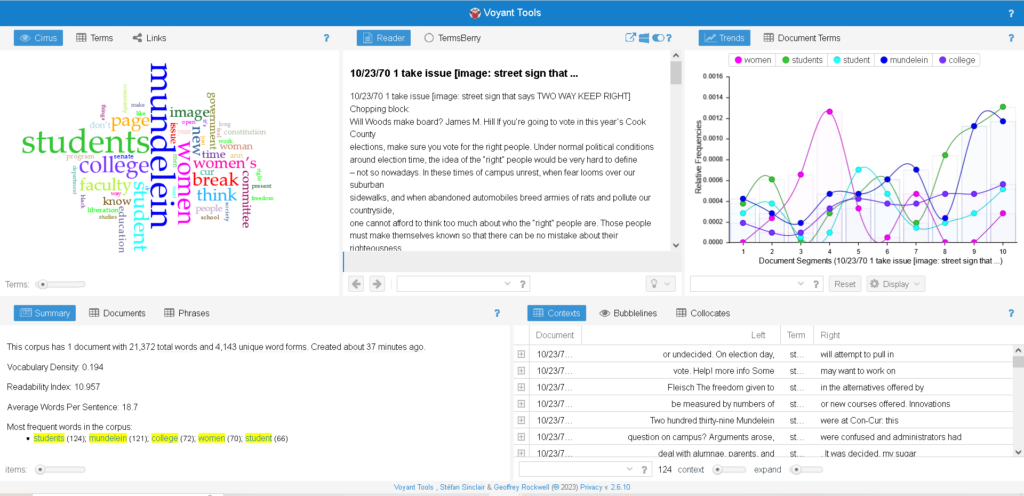
Figure I: The textual analysis of Take Issue using Voyant’s five standard tools
For this project, I chose to create a textual analysis of four transcriptions of Take Issue, a student magazine of Mundelein College which was primarily composed of featured articles. Unlike the digital archive, I was not able to pick articles from a larger time frame and as a result, I had to go off what was listed in the transcripts. The transcripts I chose corresponded to four issues of Take Issue, all of which were published sometime between October 23, 1970 and June 1971. Because of this, I ultimately decided to enter all four transcripts into Voyant in chronological order, that way the visualization and analysis might be considered to be more all encompassing than if I had merely entered just one issue. As the name Take Issue implies, coupled with all four issues being published within just over six months, there is no lack of content in any of the issues. The publication also showcases the awareness of Mundelein’s student body towards current events, covering things such as local elections to coverage of students studying abroad.
Across the four transcripts of Take Issue, there are 21,372 total words present, with the four transcripts also containing 4,143 unique word forms. The most commonly used word is “students” with 124 uses, then “mundelein” with 121 uses, “college” with 72 uses, “women” with 70 uses, and “student” with 66 uses. The addition of the final word may seem a bit redundant, however given that this is more of a student life magazine I decided to keep it in, as it fits more with the overall theme and message of Take Issue; furthermore, no term seemed to take up more than 0.0014% of the word body.

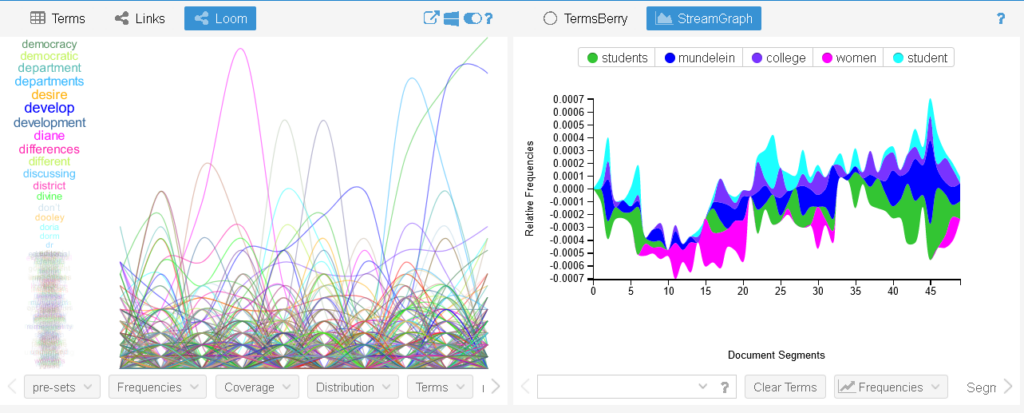
Figure II: Textual Analysis using the “Loom” and “StreamGraph” tools
Beyond the five main tools, I mainly used three additional ones. The first was the “Stream Graph” tool, which documents the relative frequency of the five most used terms across the textual segments. Secondly, there was the “Loom” tool, which sort of works like the Stream graph but includes every single term within it, allowing users to see the frequency of the term. Finally, there is the “Textual Arch” tool, which puts all of the terms in an enclosed space and reads through the transcript, while this happens, a line is drawn from one term to the next. Because the more frequently used terms can be located near the center and the less frequently used ones near the back, it can create some truly unique line segments.

Figure III: The “Textual Arc” tool hard at work
Aside from the general makeup of Voyant and locating a transcript to be used, I didn’t really face too many issues with this assignment than I did on the last one. Once I got everything down and understood it, I was able to utilize the tools at my disposal in order to create some truly unique textual visualizations. My main limitation seemed to be my own ability, or lack thereof. I hope that we have more opportunities to use Voyant, as they would allow for many more chances to do something similar to archival records other than Take Issue in the future.
Leave a Reply